
Network League Table Mortgage - Q3 2026
For more information on networks click Network Directory below
Click league table to view full size.
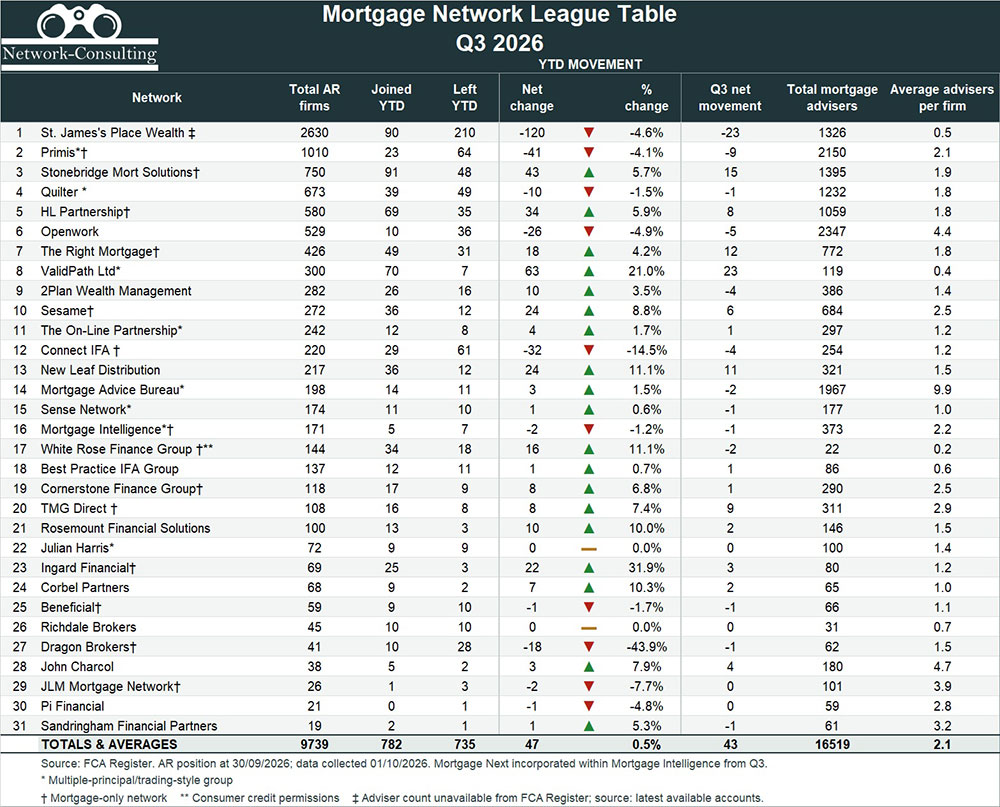
The data source for the table below is the FCA register and was correct at 2nd July 2026.
It illustrates the movement of Appointed Representative firms for each network over the period 1st January 2026 to 30th June 2026.
It is prioritised by total number of AR Firms, adviser numbers for this table only include mortgage advisers.
The size of a network does not mean they will be best for you. If you’re looking for a network, please get in touch and let us help find the best one for YOU.
* Denotes networks with multiple networks under one brand.
** Denotes network specialising in consumer credit
† Denotes dedicated mortgage networks.
CPD20 mortgage advisers, CPD21 equity release.
For more detail regarding the table and how they are collated, please go to the Network League Table overview

Growth, consolidation and changing propositions continue to reshape the network market
The latest Network Consulting Mortgage Network League Table provides an interesting snapshot of a market experiencing significant movement, consolidation and investment.
Among the larger mortgage networks, Stonebridge Mortgage Solutions and HL Partnership continue to demonstrate strong growth, recording net increases of 43 and 34 AR firms respectively during 2026.
ValidPath has recorded an even larger net increase of 63 firms, although its proposition is predominantly wealth-focused, which should be considered when comparing it directly with specialist mortgage networks.
Looking specifically at Q3, The Right Mortgage Network, New Leaf and TMG have all demonstrated notable positive momentum.
At the other end of the table, St. James’s Place continues the reduction in firm numbers evident in Q2, along with wider press coverage regarding losses of some of its larger partner firms. While Primis, Openwork, Connect and Dragon have also recorded material net reductions during 2026.
As I highlighted in my recent article, these figures shouldn’t simply be interpreted as a measure of which networks are performing well or badly.
There can be perfectly credible reasons for a network becoming smaller. Strategic consolidation, changing recruitment criteria, the removal of inactive or unsuitable firms, acquisitions and internal restructuring can all affect AR numbers.
Equally, rapid growth brings challenges of its own. Infrastructure, compliance resources and service levels all need to keep pace with an expanding network.
This is particularly relevant at a time when there is considerable structural change taking place behind the numbers.
The proposed acquisition of Stonebridge’s parent by BetterHome Group, which already owns HL Partnership, is especially interesting given the growth being demonstrated by both networks.
Mortgage Intelligence is another business to watch following its acquisition by OneDome. The table now includes Mortgage Next within Mortgage Intelligence figures, which explains the increase in total AR firms without noting new recruited firms.
It will be interesting to see how these recent changes develop over coming months and years.
There are developments elsewhere too.
Beneficial has reduced in size during 2026 but were rumoured to have agreed some form of AR transfer deal with LSL/Pivotal Growth, while Flexi Network has emerged under the same wider Beneficial Group ownership. Flexi remains relatively small with 8 AR firms, none of which appear to have left Beneficial for Flexi. It is simply another example of why understanding what is happening behind the headline numbers is so important.
Technology remains one of the most frequently discussed areas of network propositions.
Integration, automation and adviser efficiency are increasingly prominent and often quoted by most networks. One recent example of such developments was Openwork’s announcement of moving from its proprietary system to Seccl and Plannr as part of its technology transformation.
More broadly, network propositions are extending beyond traditional compliance and regulatory support. Technology, marketing, business development, succession planning and efficient financial promotions sign off, particularly with social media.
This makes comparing networks considerably more complicated than simply looking at headline percentage charges or AR numbers.
Movement is not a measure of quality
Ultimately, these tables measure movement; they don’t measure quality.
The largest network isn’t automatically the best network. Neither is the fastest-growing, the cheapest or the one offering the latest technology.
Likewise, a network experiencing a reduction in AR firms isn’t necessarily performing badly.
The important question for any adviser or firm remains whether the proposition, culture, costs, technology, support and longer-term direction of a network are appropriate for their particular business and objectives.
That’s why the numbers are interesting but understanding what sits behind them is far more important.