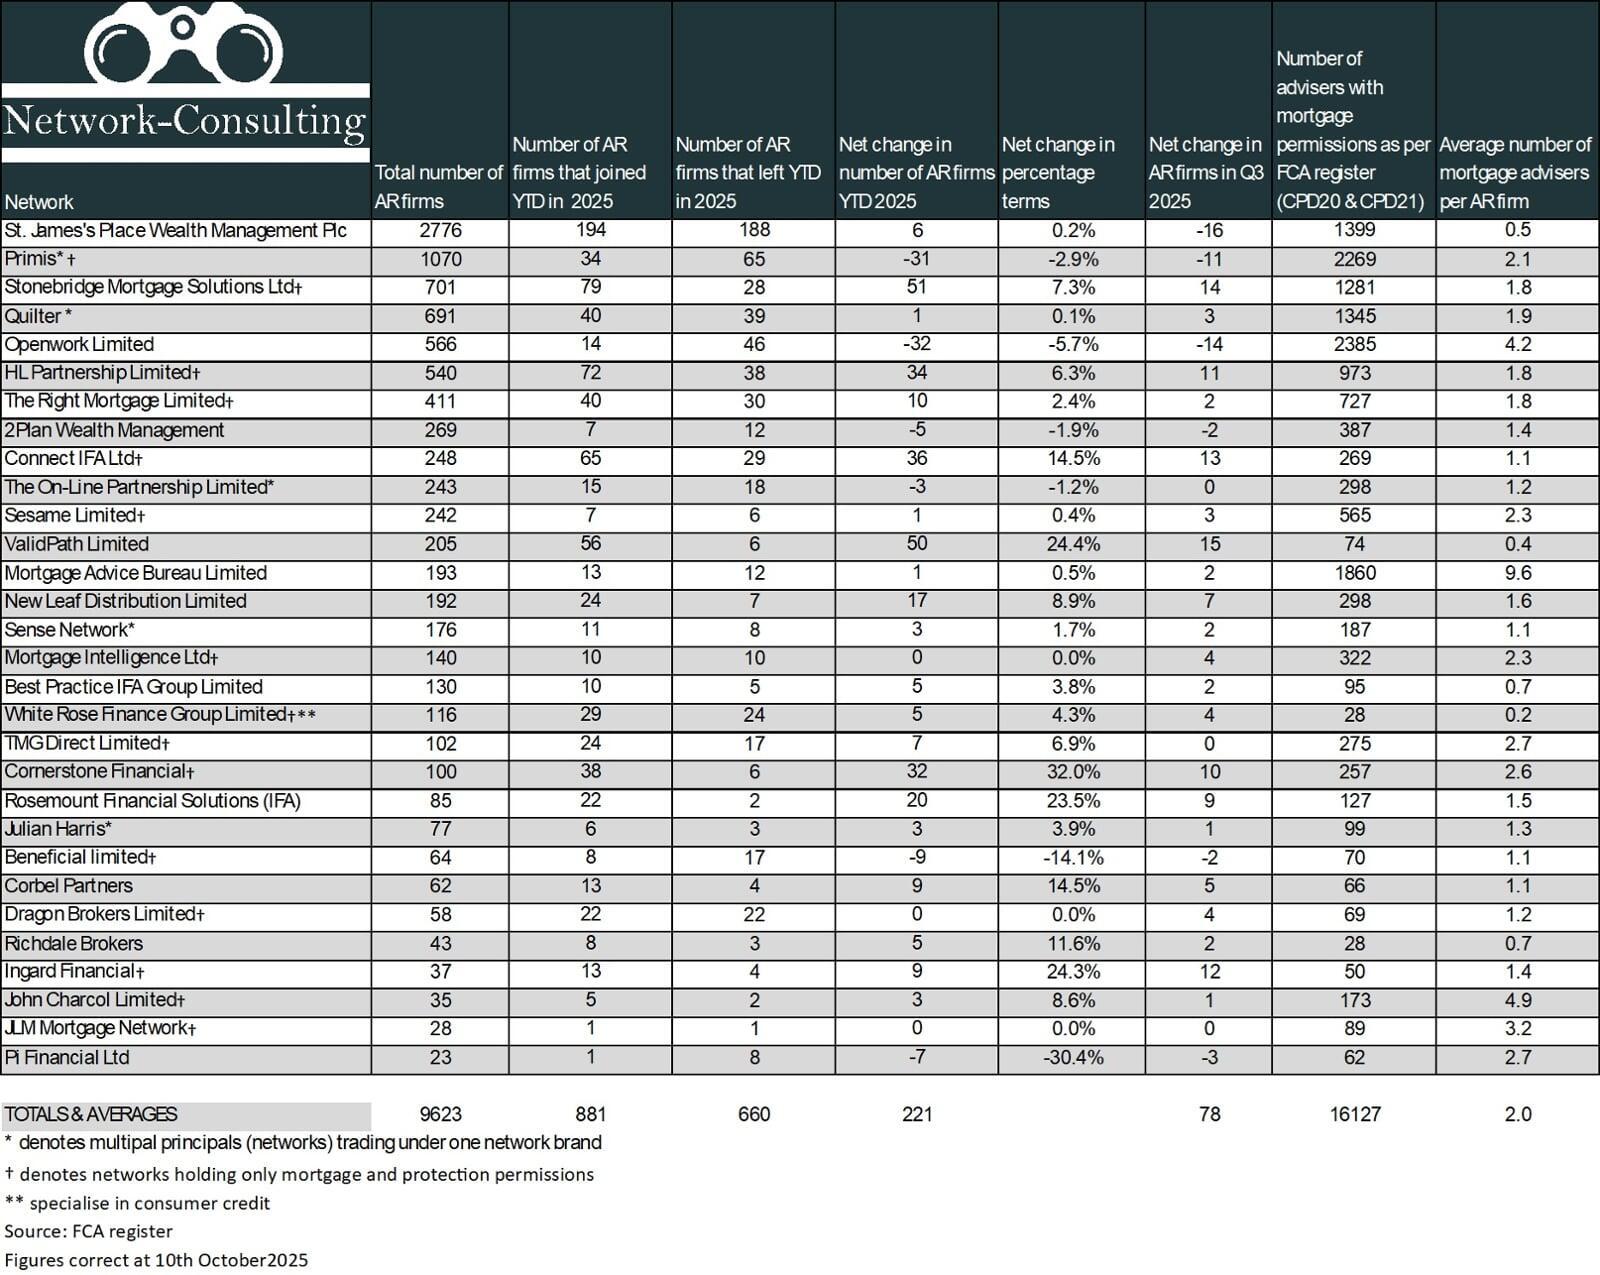
Network Consulting’s latest mortgage network table for Q3 2025 paints a clear picture of a market in motion. With 9,614 Appointed Representative (AR) firms and 16,127 advisers holding mortgage permissions, the AR intermediary sector continues its steady upward trajectory. This marks a sustained rise from 9,412 firms and 15,880 advisers in January 2024.
One possible factor behind the rise in AR firm and adviser numbers could be a shift in adviser preferences. Anecdotally, some appear to be moving away from Directly Authorised (DA) status in favour of network models offering structured support and compliance. There also seems to be growing interest among experienced advisers in establishing their own firms, potentially reflecting a desire for greater autonomy. These are themes that have emerged in conversation, though broader evidence would be needed to confirm the underlying drivers.
St. James’s Place shows the highest movement in numbers both joining and leaving, though these figures may not reflect broader market trends. Putting them to one side, Stonebridge recorded the highest gross and net growth in 2025 to date, with 79 gross and 51 net firms joining its network. Cornerstone Financial posted the highest percentage growth at 32%, continuing their momentum from previous quarters.
Other networks showing year-to-date growth above 20% include Valid Path (primarily wealth), Rosemount Financial Solutions and Ingard Financial. Ingard’s expansion appears to have accelerated in Q3, which may be linked to a change in ownership earlier in the year. While these figures are encouraging, it’s important to note that both growth and loss patterns can be influenced by a range of factors, including strategic direction, market positioning, and adviser sentiment.
Some networks have clearly experienced reductions in firm numbers. Primis, Openwork, and Quilter saw the largest decreases , losing 65,46 and 39 respectively for the year, although a small number in percentage terms for these large networks. Pi Financial recorded a 30.4% decline in percentage terms, though this represents a net loss of just seven firms. These shifts may reflect broader market dynamics or internal restructuring, but further analysis would be needed to understand the underlying causes.
Overall, the data suggests a fluid and responsive market, with advisers continuing to reassess their positions and affiliations, seeming to prefer the AR model. Whether these movements are driven by regulatory pressures, operational preferences, or strategic ambitions remains open to interpretation. From conversations within the profession, there appears to be a growing interest in models that offer flexibility and control.
In such a dynamic environment defined by movement and choice, impartial guidance can be invaluable.